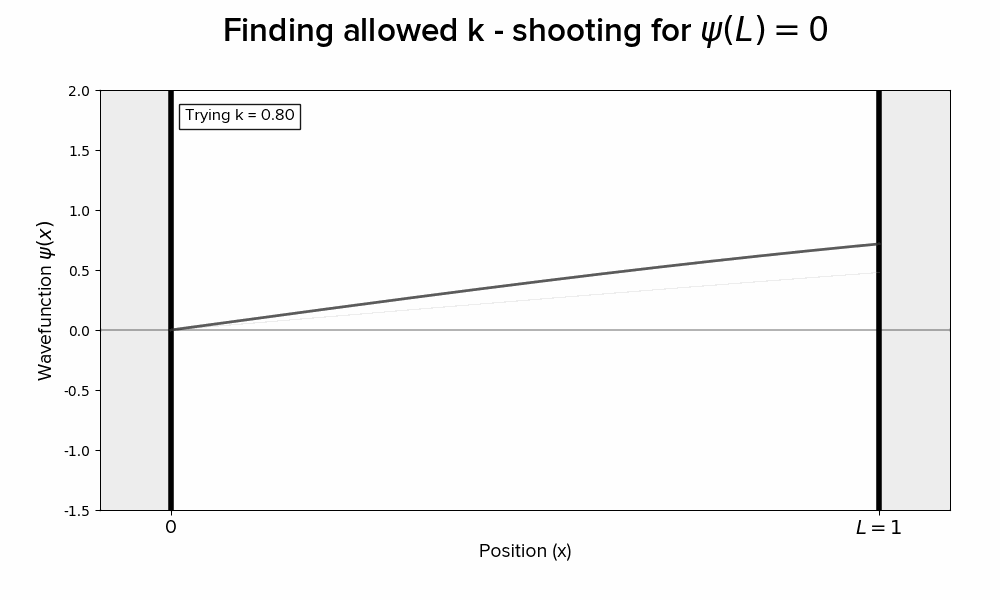
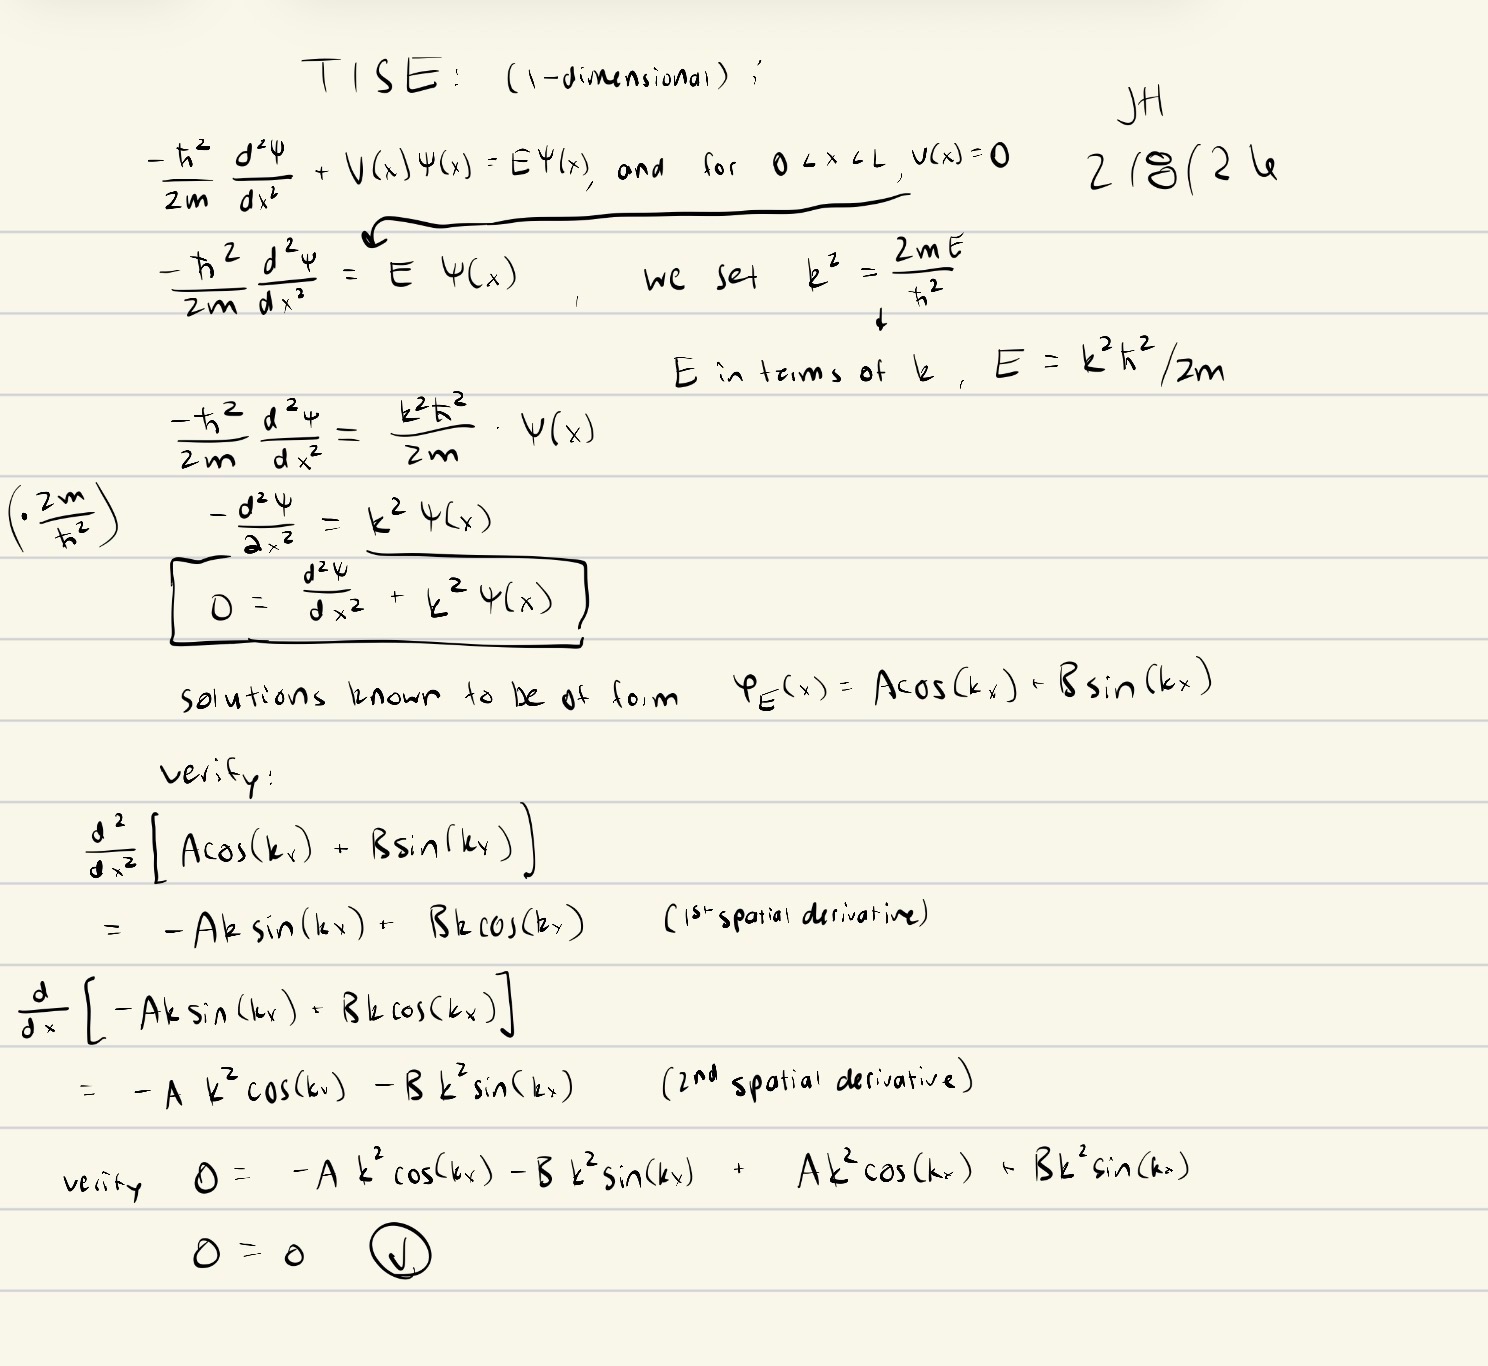
In MIT’s OpenCourseWare Physics 8.04 course the professor poses walking through many values of k where only special values of k will satisfy the boundary conditions imposed upon us. For these problems I did not find good visualizations, and I wanted to make a good visualization of particle in a box / infinite square well problems. This is just a gif visualization of the boundary conditions in the well forcing energy quantization, and I have the assumption the reader is familiar with these infinite square well / particle in a box problems.
I have my work briefly summarized on this page. Where ϕ(0) = 0 forces A to 0, leaving only the sine term to survive, he posed walking through values of k until we find those very special values of kL for which we hit 0 at position L.
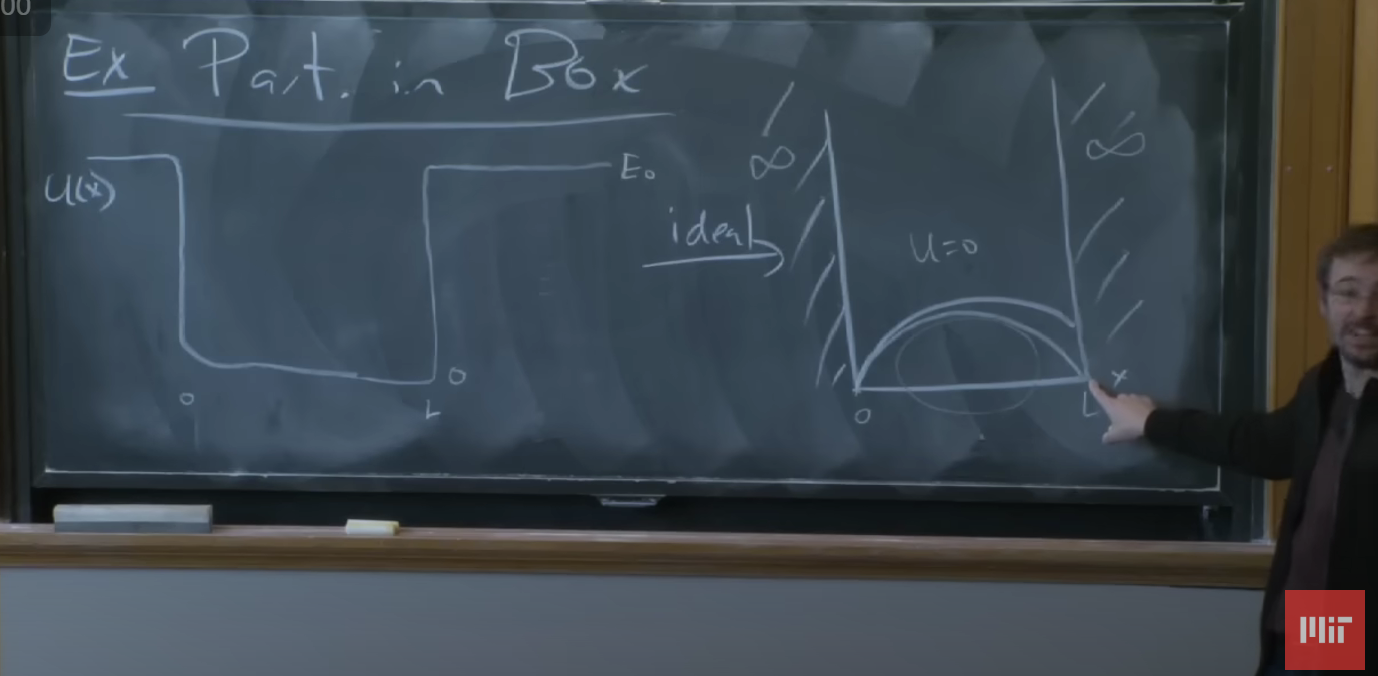
The chalkboard equivalent to the Matplotlib animation above – from 8.04 lecture 6 (https://ocw.mit.edu/courses/8-04-quantum-physics-i-spring-2013/resources/lecture-6/)
I found it really cool that even in the most trivial, idealistic, simplified example of solving the TISE, we’re faced with the peculiar fact that energy [eigenvalues] are discrete and greater than zero.
This is not an actual attempt at numerical solutions of these problems and uses a rudimentary shooting method — the Python script increments through k values in steps of 0.3 (chosen so there’s about 10 steps between solutions) until it lands on a candidate solution, then switches to a bisection algorithm that I most certainly didn’t write myself. I am definitely not the first to do this, though I do think I am the first to clean it up nicely in a gif. There are multiple people who have treated this more robustly than I have (this Bachelor’s thesis from Austria, this guy’s YouTube video on numerical methods for this exact topic). I will probably try to follow this with a similar visualization of the simple harmonic oscillator, as those failed solutions explode (diverge) at infinity which is a much more dramatic visualization for how our energies are forced to discrete values. The math is much more complicated and I don’t know how I’m going to do that.
Every graphic I saw online was either outdated or didn’t go back far enough, so this is my attempt to put a more comprehensive one out on the internet. They debuted in 2000 and here I have 2007 through 2025, I will update as I find old ones in the woods. The 2025 ball is now released to market but the image is from Titleist’s media release here. Titleist, if I need to take this down please email me.
It is very difficult to hit a ball over the net at Top Golf
For you, me, and anyone you know who is a long hitter, absolutely not.
For anyone you know who plays professional golf, still probably not.
For a long-hitting pro golfer, from the top floor, using a ball superior to a TopGolf ball, it’s possible.
For a competition-level long drive competitor, it’s very possible with a TopGolf ball
Below is an example of the model – many more included under ‘Results’
This is all based on a linear model I have relating the speeds / spin of TopGolf balls to regular balls from data I took at my own swing speed – this is limited in nature and probably fails to describe extreme conditions well (e.g. swing speed of 150mph)
Assumptions:
TopGolf dimensions are 250 yards to the back of the net, which is 150 feet tall
These are perfectly straight drives and all spin is backspin
We are hitting TopGolf balls, unless specified otherwise – TopGolf balls do NOT launch / fly like regular balls!
We are at sea level, unless specified otherwise
TopGolf balls have similar aerodynamics to regular balls
The ball’s flight function was solved for the output when x = 250, i.e., input x being distance, and output returning the ball’s altitude (in yards) at that distance. TopGolf nets measure 50 yards high at 250 yards, so if f(250) > 50, the ball will clear the net
I have no idea how to pull functions out of Excel so there was a messy step where everything was fit to a polynomial regression function, in the end the impact from this was negligible
TopGolf balls do not behave the same as regular golf balls. Based on Trackman 4 data I reported here, off driver the ball speed is 4.6% lower, launch is 6.1% lower, and spin is 28.6% higher. These data match my anecdotal experience at TopGolf. Simulations will be ran using these modified numbers, as these changes in trajectory have a significant impact on distance and apex, and thus the potential to clear the TopGolf net.
I used the data above to make a simple, linear model relating regular balls to TopGolf balls. This linear model assumes a constant, proportional relationship between the performance of the two classes of golf balls. In reality, I think at extreme swing speeds / launch conditions, factors like material deformation and aerodynamic drag will not be captured by what I do here. Does a TopGolf ball’s dimple pattern lead to more drag and shorter flight than, say, a ProV1? I suspect so but don’t have any data to back that up.
Long drivers routinely get ball speeds >220mph, so it may be a bold assumption that my data at ~150mph describe the relationship well. Some more complex model underlies the relationship of these balls that I don’t have the ability to describe.
It’s unclear what the dimensions of an average TopGolf are. Some sources describe length as 215 yards, some say 240, some say 250, and some imply 267. With the lack of clarity I’ll assume 250, which is one of the more commonly reported figures online. Most sources agree on a 150 foot fence height. One source quoted a TopGolf spokeswoman at a 170 fence height.
An example of the average PGA Tour driver’s parameters being modeled into a trajectory using OptimalFlight.
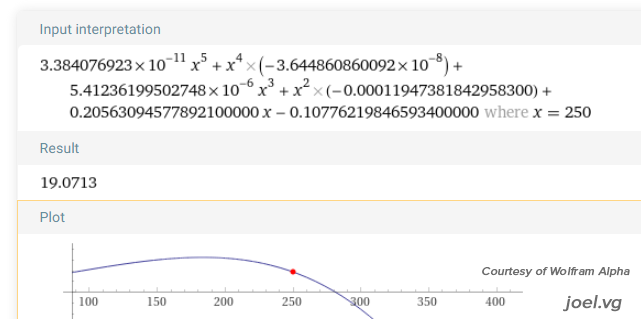
Solving the polynomial fit to our model’s ball flight, where f(250) returns the ball’s altitude in yards at 250 yards distance. For this shot, it was approx 19.1 yards, which does not clear the 50 yard net.
His ball intercepts the net at 10.0 yards of height. Closer!
His ball intercepts the net at 10.0 yards. It would have carried 263.2 had its flight not been obstructed (remember – this model uses a TopGolf ball)
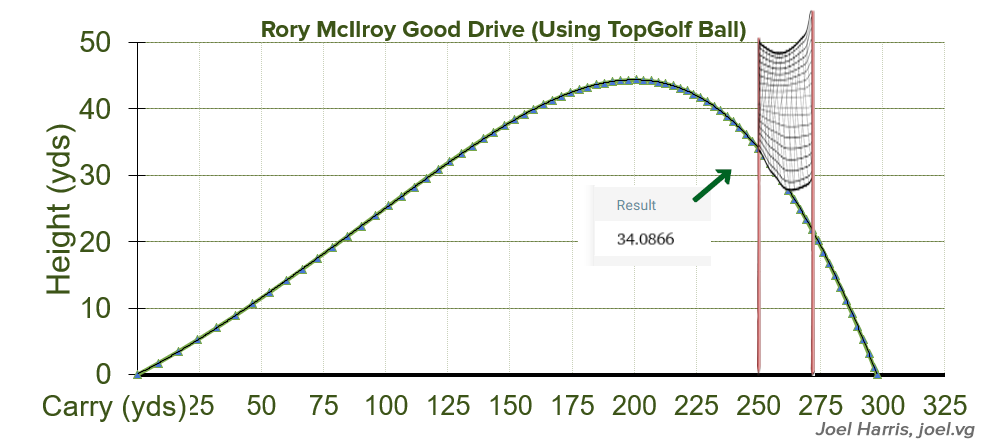
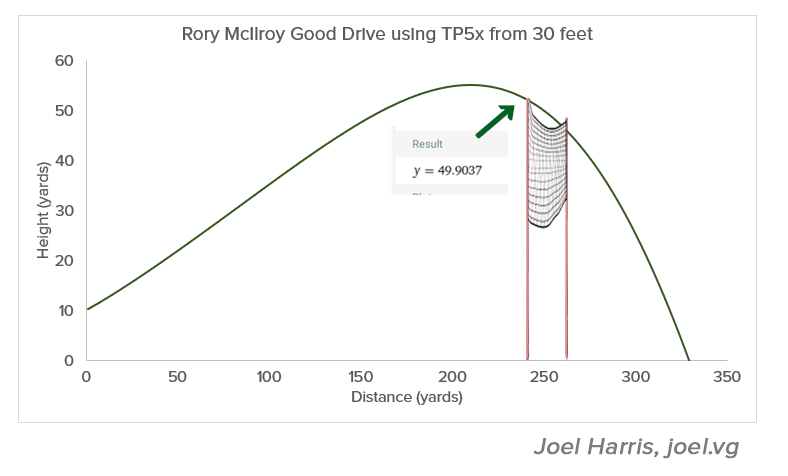
Typical / good drive from Rory McIlroy:
As of March 12th, 2023, Rory’s average driver ball speed in competition is 184.6 mph. In 2017 Rory tweeted his launch monitor numbers, including a ball speed of 184.1 mph, so I think this is a good enough approximation of his current average. This likely represents a better than average strike given the carry and total.
Ball speed: 184.1 mph → 175.6 mph with TopGolf ball
Spin: 2523 rpm → 3245 rpm
Launch: 12.5° → 11.7°
His ball intercepts the net at 34.1 yards of height. The first to threaten it!
This shot would have carried 297.9 had its flight been unobstructed. Had it been a normal ball rather than a TopGolf ball, this carry would have been 320-330 at sea level.
OK, What if Rory brought a TP5x or ProV1 to TopGolf and hit that, and he’s also on the 3rd floor??
Same input parameters as above, I just did not apply the speed / spin / launch penalties of a TopGolf ball
184.1 mph, 2523 rpm, 12.5° launch
I made the assumption that the hitting surface of the top deck is 30 feet from the ground level. It may be higher but I do not have any numbers on this.
Just mere inches short!
Just a hair short of the 50 yd / 150 foot net! As a reminder, the graphic of the net is just a quick addition in Photoshop – the true answer comes from solving our polynomial regression for f(250), which in this case was 49.9 yards.
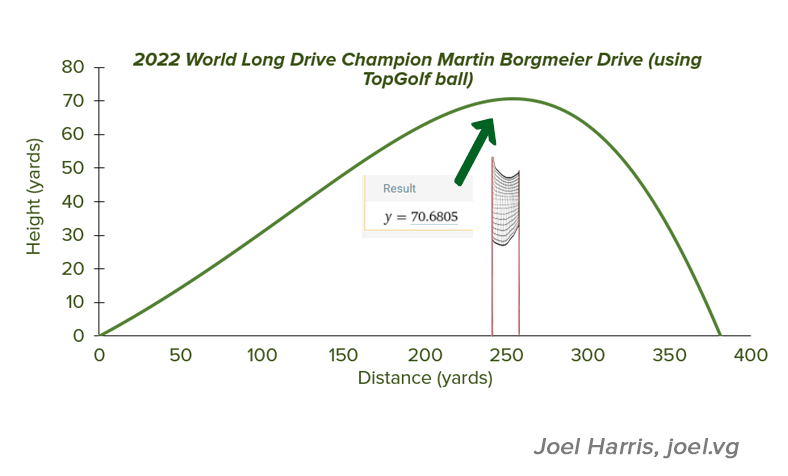
Great strike from 2022 World Long Drive Champion, Martin Borgmeier:


